
Digital Marketing Strategy Goals: How to Set Them
Set digital marketing strategy goals that tie to revenue, using SMART or OKR frameworks, channel KPIs, key events and a monthly review routine.
Grow your LinkedIn to the next level.
Use ViralBrain to analyze top creators and create posts that perform.
Try ViralBrain free56% of marketers report difficulty attributing ROI to content in the Content Marketing Institute B2B content marketing research for 2025. The same share struggle to track customer journeys. That is the problem with digital marketing strategy goals. Most guides pretend tracking works cleanly. It doesn't. You need goals that still help you decide when the data is messy, late, or incomplete.
The audience is big enough to hide weak thinking. DataReportal reported 5.65 billion people online by July 2025, and 2.58 billion people remained offline. Reach is easy to buy or borrow for a week. Revenue is harder. Set goals that connect reach to qualified action, and judge them with a review routine you will follow.
Turn a Business Target Into a Marketing Goal
Teams often start with the channel. They pick LinkedIn, email, or paid search, then invent a target that sounds busy. That order is backwards. Marketing goals start from the business number. A goal with no revenue link is activity with a deadline. It creates reports. It doesn't tell anyone what to stop, fix, or fund.
Start with money, then work back to audience behavior. A SaaS team might need new pipeline, a consultant might need booked calls, and a store might need profitable orders. The marketing goal should name the business step your work can move in the period. If you cannot draw a short line from the goal to revenue, rewrite it.
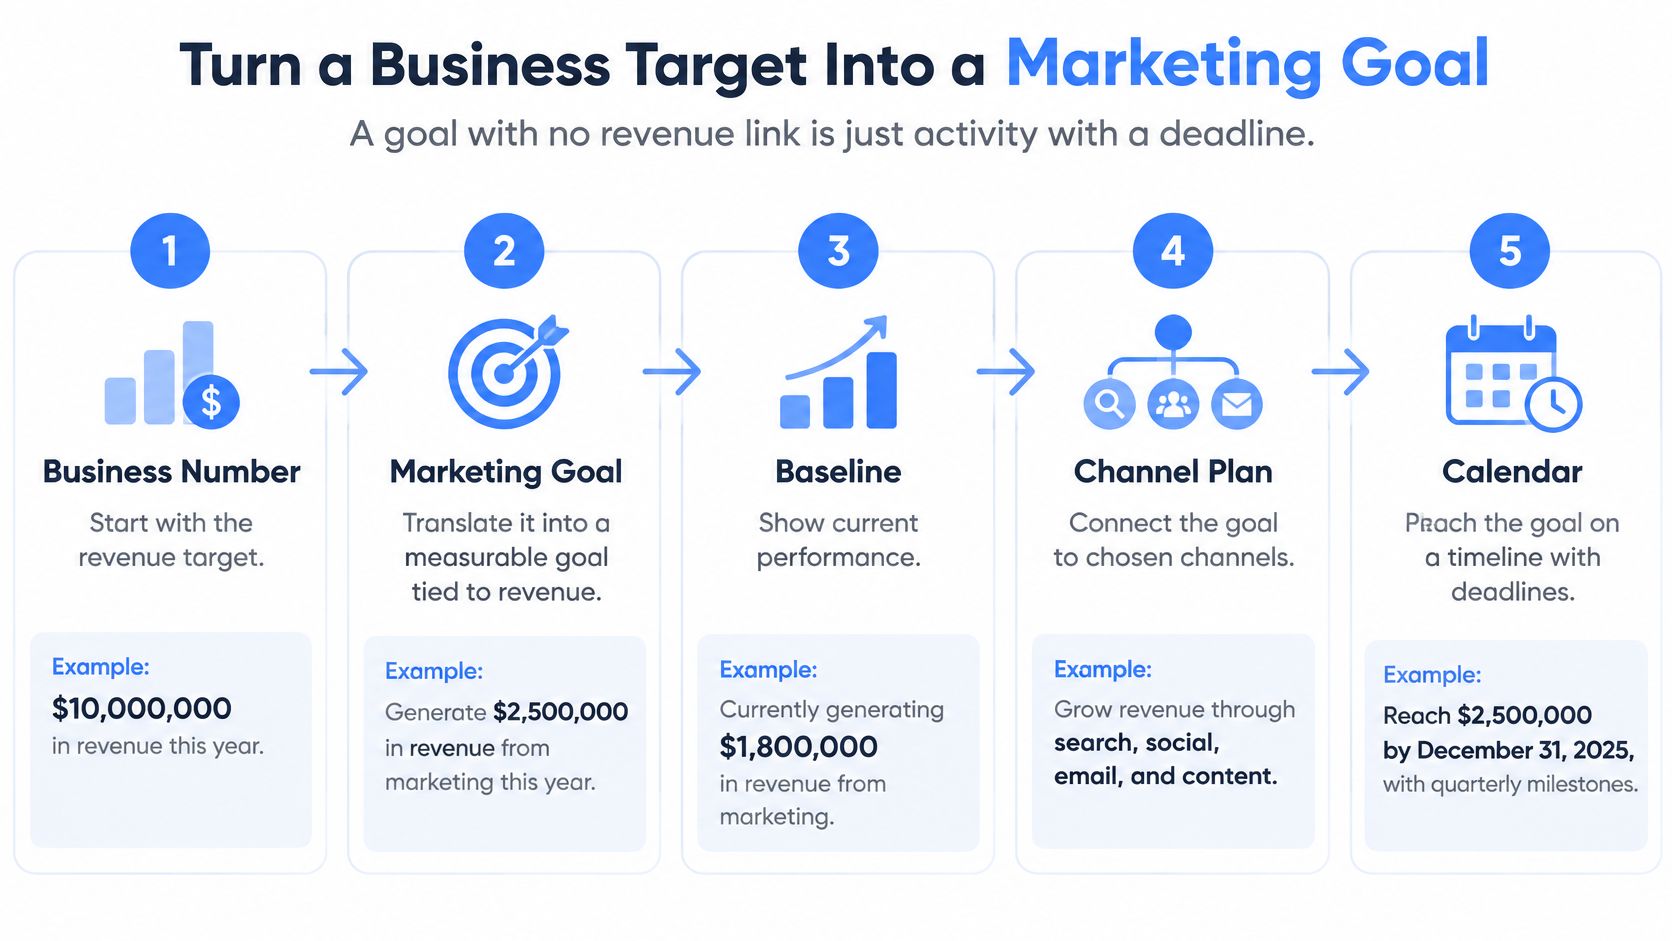
The five step routine
- Write the business target as a number with a date. Say the target is 2 million dollars in new annual recurring revenue by December 31. Vague growth language gives every team a different target. A dated number forces trade offs about budget, hiring, and sales capacity.
- Work backward through the funnel. Map the stages that create that revenue. For B2B, that may run from qualified visits to demo requests, then sales accepted leads, then opportunities, then closed deals. Use your real conversion rates between stages. Made up rates produce made up confidence.
- Pull the baseline from the last two quarters. Don't use your best month. Don't use the launch spike. Two quarters smooths holidays, one viral post, and one broken form. If tracking changed during that period, say so on the goal sheet.
- Pick one primary outcome and a few leading indicators. The primary outcome might be demo requests from target accounts. Leading indicators might be qualified profile visits, repeat engagement from target roles, and landing page conversion rate. Indicators move first. They warn you before the quarter is gone.
- Check budget and sales capacity. A demo target means nothing if sales cannot take the meetings. A lead target means little if paid media cannot buy enough qualified traffic at a sane cost. Get sales to confirm follow up capacity before you promise volume.
Use benchmarks as sanity checks
Outside numbers can stop fantasy targets. McKinsey reports personalization can reduce customer acquisition costs by as much as 50% and increase revenues by 5% to 15%. Those are not promises for your account. They are guardrails. If your plan assumes acquisition cost will fall by more than that with no new data, no better offer, and no better audience, your plan is doing stand up comedy.
Use the same logic in reverse. If your current conversion rate is weak, a small lift may beat a large traffic push. Fixing message fit for one segment can cost less than buying more visits from everyone. That is why goals should name the segment, not just the channel.
Write the goal in one sentence. Name the metric, the baseline, the target, the date, and the channel.
Use this format. Increase demo requests from target accounts from 22 per quarter to 35 per quarter by the end of Q3 through LinkedIn organic and paid search. It's plain. It can fail in public. That's useful. A goal that cannot fail cannot teach you anything.
Tie the sentence to money before work begins. If sales closes a known share of accepted demos at a known average contract value, you can estimate pipeline value without pretending every demo becomes revenue. Our guide to measuring content marketing return on investment fits here because the math should be agreed before the first post goes live. I would rather have one honest goal with rough math than five polished goals nobody owns.
SMART or OKR for Marketing Teams
Use SMART for one channel with one clear number. Use OKR when several channels share one revenue goal. That's the decision rule. Most arguments about frameworks hide a simpler issue. Teams want the label without the review habit. The framework won't save a goal nobody checks.
SMART means specific, measurable, achievable, relevant, and time bound. It works when the work is narrow. A target for 300 profile visits from target accounts each month is easy to own, easy to check, and easy to kill if the audience stops responding. One channel owner can see the miss early.
OKR means one objective with three to five key results. It works when LinkedIn, search, email, and paid media all push toward the same pipeline number. The objective gives direction. The key results show whether different teams are moving the shared outcome or just winning their own small scoreboards.
| Feature | SMART | OKR |
|---|---|---|
| What it sets | One specific target per goal | One objective with three to five key results |
| Best for | A single channel or campaign with a clear number | Several channels working toward one revenue goal |
| Review cadence | Monthly or quarterly check against a fixed target | Weekly check ins with a quarterly score |
| Example | 300 profile visits from target accounts each month | Grow qualified pipeline from target accounts this quarter |
| Main risk | Targets go stale when the market moves | Key results turn into activity counts |
Where each one breaks
SMART goals go stale. You set a number in January, the market shifts in March, and the team keeps chasing a target that no longer matches price, demand, or sales capacity. The fix is simple. Review the assumption, not just the number. If the offer changed, the target may need to change with it.
OKR goals drift into effort counting. Posts published, emails sent, and webinars hosted are work items. They are not results. A key result should describe a change in audience or business behavior. If the number can rise while buyers ignore you, it's a weak key result.
The hybrid most B2B teams use
Use OKR at the quarter level. Use SMART at the channel level. The quarter objective might be to increase qualified pipeline from finance leaders at midsize SaaS firms. Under it, LinkedIn gets a SMART target for qualified profile visits, paid search gets a SMART target for cost per demo request, and email gets a SMART target for replies from target accounts.
This setup keeps debate honest. Channel owners cannot hide behind the big objective. Leaders cannot pretend three channel wins equal revenue if pipeline stayed flat. Score the OKR each week with short notes on what moved and what blocked progress. Close it each quarter, even if the score is ugly.
Don't score effort as success. A team can publish every planned post and still miss the buyer. A team can miss a posting target and still create strong pipeline from fewer, better pieces. Judge the outcome first. Then inspect the activity to learn why it happened.
I would pick the simpler system your team will review without groaning. A small team with one channel doesn't need OKR theater. A larger team with shared pipeline targets needs more than isolated SMART goals. Pick based on coordination cost. That is the part people skip.
KPIs That Matter on Each Channel
Use three layers. Awareness signals show distribution. Response metrics show interest. Commercial metrics show money movement. If you mix the layers, every meeting becomes an argument about which number matters. Sort them first. Then judge each channel by its job.
Awareness signals include impressions and engagement. They tell you whether people saw the work and reacted at all. Response metrics include click through rate and landing page conversion rate. They tell you whether interest survived the click. Commercial metrics include qualified leads, opportunity rate, customer acquisition cost, pipeline, and payback. They tell you whether the work can support a business case.
Every channel needs one primary KPI from the commercial layer or the closest honest step toward it. Supporting KPIs explain why the primary moved. If demo requests fall, supporting numbers should tell you whether reach dropped, clicks weakened, the page broke trust, or the wrong audience showed up.
| Channel | Primary KPI | Supporting KPIs | Typical lag |
|---|---|---|---|
| LinkedIn organic | Qualified profile visits from target accounts | Engagement from target roles, connection requests accepted, comments from buyers | Days to weeks |
| Replies or demo bookings per 1,000 sends | Open rate, click rate, unsubscribe rate | Same day to two weeks | |
| Paid media | Cost per qualified lead | Click through rate, landing page conversion rate, cost per opportunity | Days |
| Content and SEO | Organic sign ups or demo requests from content | Branded search growth, returning visitors, assisted conversions | Three to six months |
| Personal brand | Inbound conversations with target buyers | Profile views from target roles, saves, follows from target roles | Two to four months |
Rules the table cannot show
For LinkedIn, a profile visit counts only when the visitor role or company matches your target list. A student, a competitor, and a head of sales are not equal visits. Stop adding them together and calling it demand. Our guide on how to measure social media success is useful here because audience quality matters more than raw applause.
Email needs a harder test than opens. Opens are noisy. Replies, booked calls, and qualified clicks show intent. Paid media can move fast, so judge it on cost per qualified lead early. Cheap leads that sales rejects are not cheap. They are paid clutter.
Content and SEO need patience with structure. The lag runs three to six months, so judge the first quarter on branded search growth and assisted conversions instead of direct demo requests alone. That does not mean content gets a free pass. It means you use earlier signals while the commercial proof catches up.
Personal brand work needs the same discipline. Inbound conversations with target buyers beat follower growth from random accounts. Saves and comments help only when they come from people who can buy, refer, hire, or partner. If your audience grows but your buyer conversations don't, you built a crowd. Crowds are fun. They don't always pay rent.
If follower count is the only number rising, the channel is not yet producing a goal result.
Benchmarks differ by industry, audience size, price point, and sales cycle. Set the first baseline from your own data. Outside benchmark lists can help you spot a broken funnel, but they should not set your target. Teams that work with creators can use key creator campaign metrics for 2026 to compare creator reporting with their own KPI layers. Use it as reference material. Then return to your baseline, your buyers, and your sales feedback.
Set Up Key Events So Reports Agree
A key event is a tracked action tied to business success. Google Analytics 4 key event guidance gives examples such as a form submission, product signup, demo request, purchase, or qualified lead. That definition matters. If the action does not matter to the business, don't promote it just because the button exists.
Reports disagree when teams name the same action five ways. Sales counts CRM records. Paid media counts platform conversions. Analytics counts events. Then everyone brings a different victory chart to the same meeting. It's less a review. More group fiction.
The setup routine
- Create or identify the event in Google Analytics 4. Mark it as a key event. Review how many users completed it. This gives the goal a measurable action beyond impressions and likes.
- Choose one primary key event per campaign. Keep supporting events separate. A LinkedIn campaign might use completed demo request as primary, while profile visits, post clicks, and email signups stay supporting. If everything is primary, the report becomes a junk drawer.
- Name the event exactly as it appears in the tag. Mismatched names break registration. One stray capital letter can split your data and waste an afternoon.
- Document the trigger. Write the page or action that fires the event. Add the owner. Add source and medium fields. Future you will be grateful.
- Tag every LinkedIn link with UTM parameters. Keep source and medium values consistent. Our guide to LinkedIn conversion tracking helps teams keep campaign names readable before reporting turns messy.
- Import the event as a Google Ads conversion when paid media optimizes against it. Paid teams should optimize toward the same business action everyone else reports. If ads chase a softer action, cheap volume will look like progress.
- Check each week that the count matches the CRM. Small gaps happen. Large gaps mean broken tags, duplicate events, bad filters, or leads that never reached sales. Fix the pipe before you judge the campaign.
One event name matters because a demo request is the same business outcome on every channel. A request from a LinkedIn post and a request from paid search should count the same way. Then you can compare channels without changing the definition of success mid sentence.
Ecommerce teams face the same issue with revenue events after refunds and discounts change the final value. BigCommerce discounts and refunds explained is a useful reference for keeping order value logic clean before it reaches reports. B2B teams have fewer refunds, but the rule holds. Define the value once. Use it everywhere.
Count users who completed the action. Don't count sessions or clicks and call them conversions. Traffic can rise while qualified actions stay flat. That is not a win. That is a louder room with the same number of buyers.
Attribution and Incrementality Without False Certainty
Last click is a baseline. It is not the truth. It gives all credit to the final touch, which is neat, fast, and often unfair to the work that created demand. Use it as a starting view. Then compare other models before you move money.
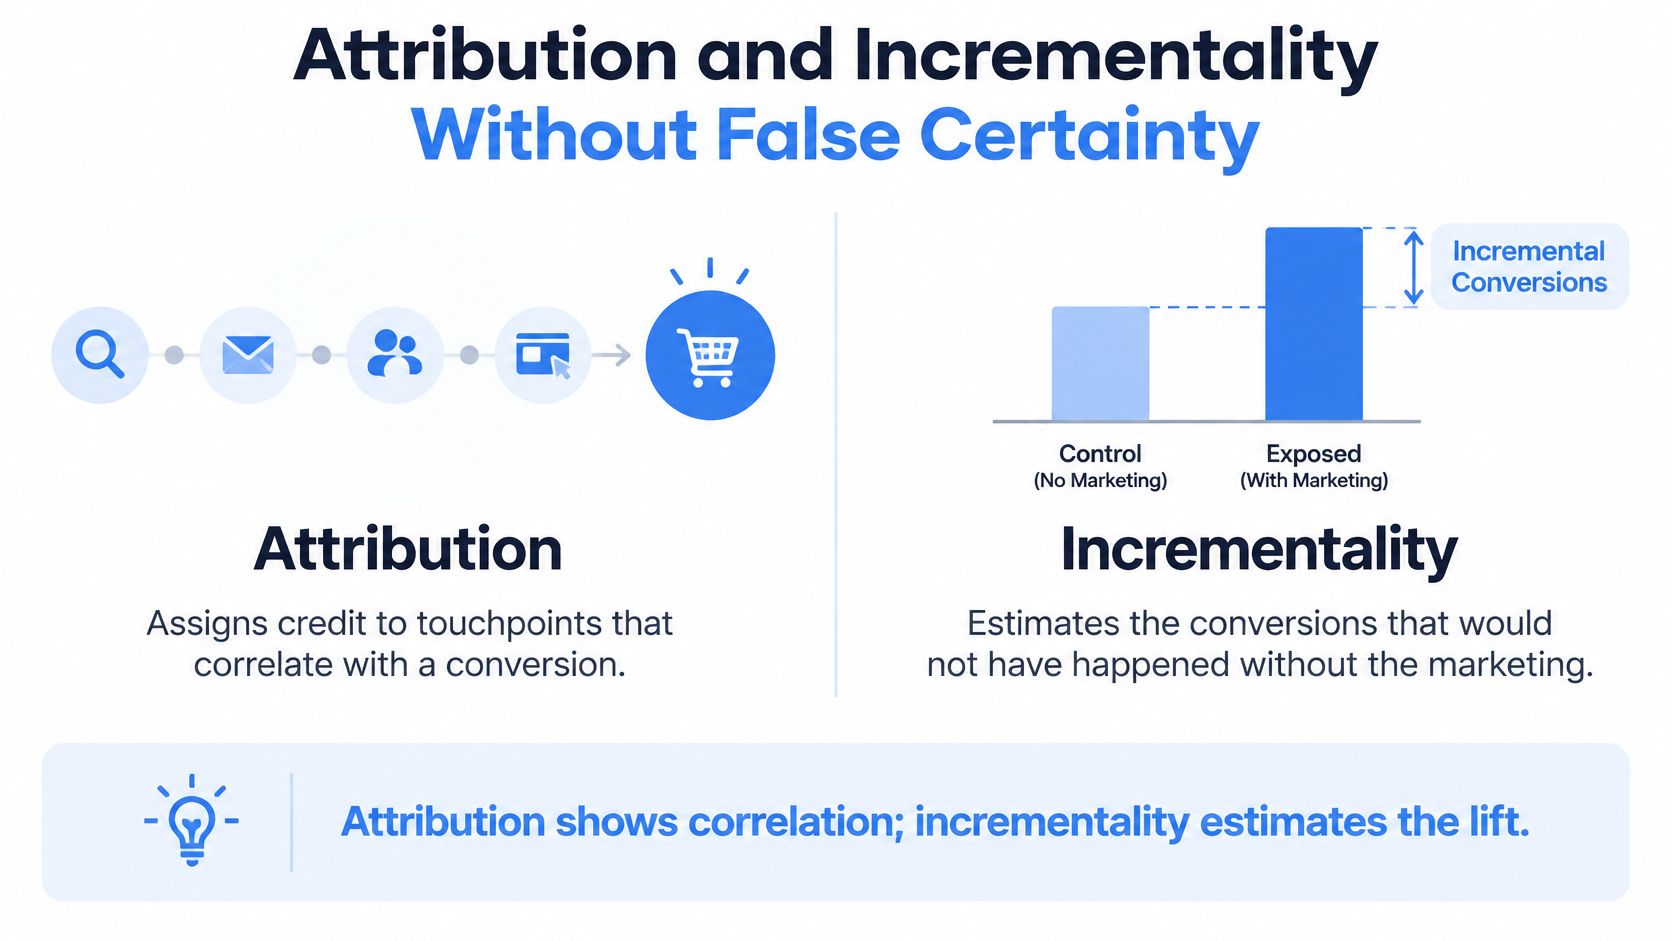
Attribution assigns credit to touchpoints correlated with conversion, while incrementality estimates conversions that would not have occurred without the marketing intervention according to Google Analytics attribution guidance. That difference is the whole game. Correlation says a channel was present. Incrementality tries to estimate whether the channel changed the outcome.
The diagram below puts the two ideas side by side so the team stops using them as synonyms.
Document the journey before you argue about credit. Record path length, time to conversion, channels involved, and conversion value. Set last click as the baseline. Compare it with linear, time decay, position based, and data driven models. When models disagree, that disagreement is data. It tells you the journey is shared.
Data driven attribution needs enough account conversion data to estimate contribution. Google Ads data driven attribution guidance says the model evaluates interactions across the conversion path rather than giving all credit to a fixed rule. Small accounts should read early results as direction, not proof. Thin data plus confident language makes expensive mistakes.
A common budget mistake
Say a B2B team cuts LinkedIn spend because last click gives it little credit. Paid search looks strong because it captures people already searching. The next month, sales accepted leads fall. LinkedIn had started many journeys. Search closed them. The team cut the spark and kept the net, then wondered why the pond felt empty.
The short video below gives a plain walk through of the measurement problem before you set your own test rules.
Use a measurement ladder. Attention metrics show distribution. Relationship metrics show audience quality, such as repeat engagement from target accounts. Conversion metrics show intent. Holdout or geo tests help estimate causal impact. Each rung answers a smaller question. None answers every question.
For LinkedIn goals, separate reach and engagement from qualified profile visits, demo requests, sales accepted leads, pipeline sourced, and revenue influenced. A post can be strong at attention and weak at intent. That is not failure. It's a signal to fix the next step, maybe the profile, the offer, or the landing page.
No budget shifts until definitions are consistent, the CRM reconciles, and one incrementality check has run.
Holdouts do not need to be grand. Pause one audience segment. Hold one region. Compare matched account groups. Small tests beat confident guessing. If you cannot run a clean test, say the result is directional in the report. Honest labels protect future budgets.
Build a Goal Sheet and Review Cadence
Start with a one page KPI contract for every goal. Write it before the first campaign runs. If the sheet needs a meeting to explain, it's too long. The sheet should let a new hire understand the goal, the audience, the number, the owner, and the next decision date. That's enough.
Use seven fields. Write the objective. Name the target segment. Record the baseline. Set the time horizon. Assign the owner. Define the events. Set data quality thresholds. Those fields prevent the usual drift where the target stays fixed but the definition changes without notice after results look bad.
The need is not theoretical. HubSpot reported 33% of surveyed marketing leaders identified measuring marketing ROI as their hardest challenge. Put ROI on the sheet as a standing line item. If the team cannot explain the return in plain words, the dashboard is decoration.
HubSpot lists traffic, MQLs, CAC, conversion rate, customer lifetime value, and return on ad spend as audit benchmarks in that same piece of guidance. You don't need every metric on every goal. You need the right few. A goal sheet with twenty KPIs usually means nobody picked a primary outcome.
| Review cadence | What you check | Who reviews | Decision it supports |
|---|---|---|---|
| Weekly | Delivery, post reach, experiment signals, broken tracking | Channel owner | Fix tracking or swap a test variant |
| Monthly | Cohort conversion rate, acquisition cost, MQL quality | Marketing lead with sales ops | Move budget between channels |
| Quarterly | Pipeline, revenue, payback period | Leadership with finance | Keep, scale or stop a goal |
What each review should do
Weekly reviews fix delivery. Check broken tracking first. Then look at reach, experiment signals, and obvious audience mismatch. Don't move big budget on one odd week unless tracking is broken or spend is burning with no qualified response. Weekly is for repairs and small tests.
Monthly reviews judge quality. Bring marketing and sales ops into the same room. Check cohort conversion, acquisition cost, and MQL quality. If sales rejects the leads, listen hard. Marketing does not get to declare quality alone.
Quarterly reviews decide fate. Leadership and finance check pipeline, revenue, and payback. Keep, scale, or stop the goal. Sacred channels get questioned. Good. A channel that cannot survive a quarterly money review should not survive on habit.
Search visibility now needs watching beyond classic rankings, especially as AI answers change how buyers find brands. Teams reviewing that layer can compare AI search monitoring tools during the monthly review. Keep it as a visibility check. Don't let a new tool distract from pipeline quality.
Use one decision rule. A channel that misses its primary KPI for two monthly reviews gets a new test. It does not get a new headline in the report. Change the audience, the offer, the hook, the page, or the follow up. Then measure again. Rewriting the story without changing the work is just nicer losing.
Before each monthly review, check four things.
- MQL criteria are written down. Sales and marketing use the same definition.
- Platform conversions are not reported as CRM outcomes. Clicks and modeled conversions stay in their lane.
- No goal changed mid test. If it changed, restart the read period and say why.
- Follower growth is not standing in for pipeline or retention. Growth helps only when the right people stay and act.
Pick One Goal and Put It on the Calendar
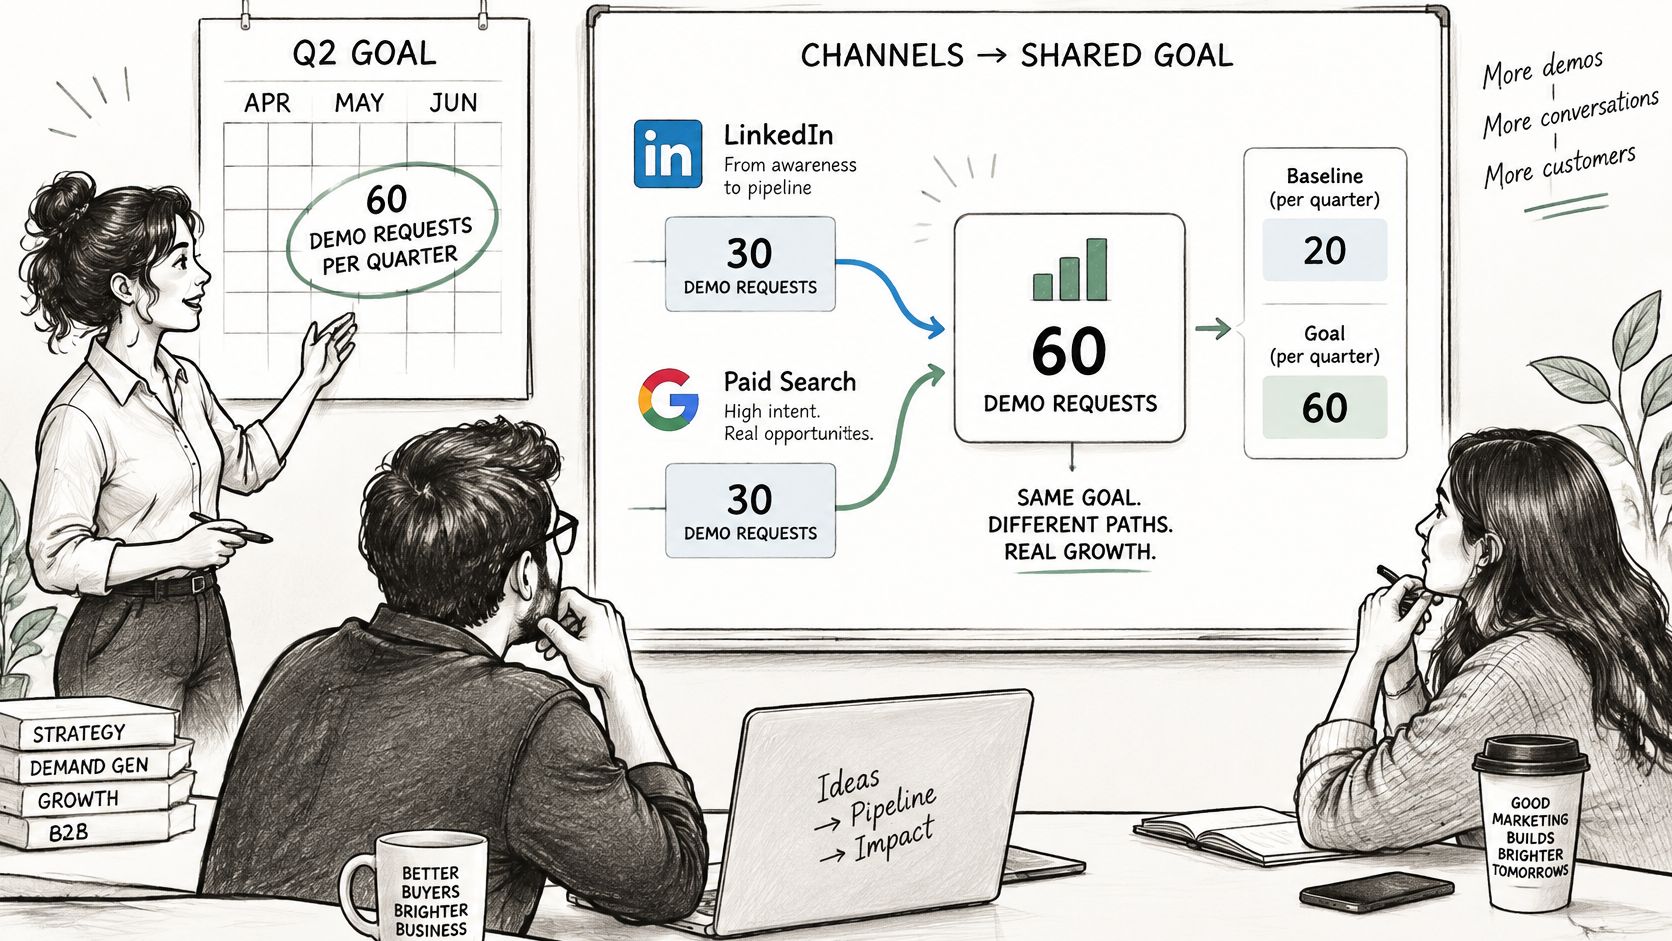
Say a B2B SaaS team sets a target of 60 demo requests per quarter from LinkedIn and paid search. Both channels feed one key event. The counts compare fairly. The baseline comes from last quarter, warts included. The cost per demo ceiling comes from the sales win rate and average deal size, not from a manager's mood. That is a workable goal.
This example leaves out follower counts and impression totals on purpose. Neither pays the bills. They can sit in supporting rows where they belong. The team still watches them for early warnings. It just refuses to call them the goal.
The photo below shows the kind of planning session that should end with one primary goal on the wall, not nine sticky notes with equal weight.
A founder example
A founder building a consulting brand might target 8 qualified discovery calls a month from LinkedIn. Each call gets tagged by source in the CRM. A secondary goal could be 40 profile visits from target buyers each week. The calls pay. The visits warn. That order matters.
Keep the list short. Pick one primary goal per quarter and at most two secondary goals. More than that splits attention until every channel gets a little effort and none gets enough. You will feel busy. The buyer will feel nothing. Focus is not a motivational poster. It's a budget rule.
Plan a 90 day timeline with a check at day 30 and a full review at day 90. Check at 30 days because broken tracking shows up early. Bad audience fit shows up early too. Waiting 90 days to discover a broken form is not patience. It's waste with better branding.
Week one moves
- Pick one primary goal. Write it as one sentence with a baseline, target, date, and channel.
- Write the KPI contract. Keep it to one page. Name the owner.
- Book the review slots for the next three months. Weekly, monthly, and quarterly. Put them on real calendars with real people.
- Plan the first two weeks of posts around the primary KPI. Each post should push toward a qualified profile visit, a reply, a signup, or a demo request. If a post has no job, it can wait.
Steady output helps once the goal is clear. ViralBrain is an AI platform for LinkedIn and X content. It analyzes your writing and the creators you choose, generates posts in your voice, helps you refine them, and schedules them on a calendar. The 30 Day Auto Calendar plans and auto publishes a month of LinkedIn posts. Use that kind of support to keep publishing consistent while you judge results by buyer action, not posting streaks.
Don't confuse the calendar with the goal. A full calendar can still produce empty pipeline. A lean calendar with sharp topics, target account engagement, and clean tracking can beat it. Put the goal on the calendar. Then make the content earn its slot.
Pick one revenue-linked goal, set the key event, and book the review dates before the next post goes out. ViralBrain helps creators, marketers, and entrepreneurs turn proven LinkedIn patterns into posts in their own voice, then schedule a month of content so output stays steady while you measure what buyers do. Start with your profile, build the calendar, and judge every post by qualified action instead of applause.
Grow your LinkedIn to the next level.
Use ViralBrain to analyze top creators and create posts that perform.
Try ViralBrain free